 1
 2
 3
 4
 5
 6
 7
 8
 9
10
11
12
13
14
15
16
17
18
19
20
21
22
23
24
25
26
27
28
29
30
31
32
33
34
35
36
37
38
39
40
41
42
43
44
45
46
47
48
49
50
51
52
53
54
55
56
57
58
59
60
61
62
63
64
65
66
67
68
69
70
71
72
73
74
75
76
77
78
79
80
81
82
83
84
85
86
87
88
89
90
91
92
93
94
95
96
97
98
99
100
101
102
103
104
105
106
107
108
109
110
111
112
113
114
115
116
117
118
119
120
121
122
123
124
125
126
127
128
129
130
131
132
133
134
135
136
137
138
139
140
141
142
143
|
import { css, cx } from '@emotion/css';
import { PanelProps } from '@grafana/data';
import { useStyles2 } from '@grafana/ui';
import { Button, ConfigProvider, Spin, Table, theme } from 'antd';
import type { ColumnsType } from 'antd/es/table';
import axios from 'axios';
import React, { useEffect } from 'react';
import { OptionsJsonConfig, SimpleOptions } from 'types';
interface Props extends PanelProps<SimpleOptions> {} // PanelProps, Grafana给Panel的环境数据
const getStyles = () => { // Panel框,样式
return {
wrapper: css`
font-family: Open Sans;
position: relative;
`,
svg: css`
position: absolute;
top: 0;
left: 0;
`,
textBox: css`
position: absolute;
bottom: 0;
left: 0;
padding: 10px;
`,
};
};
export const SimplePanel: React.FC<Props> = ({ options, data, width, height, replaceVariables }) => {
const styles = useStyles2(getStyles);
const { darkAlgorithm } = theme; // 默认使用antd dark主题
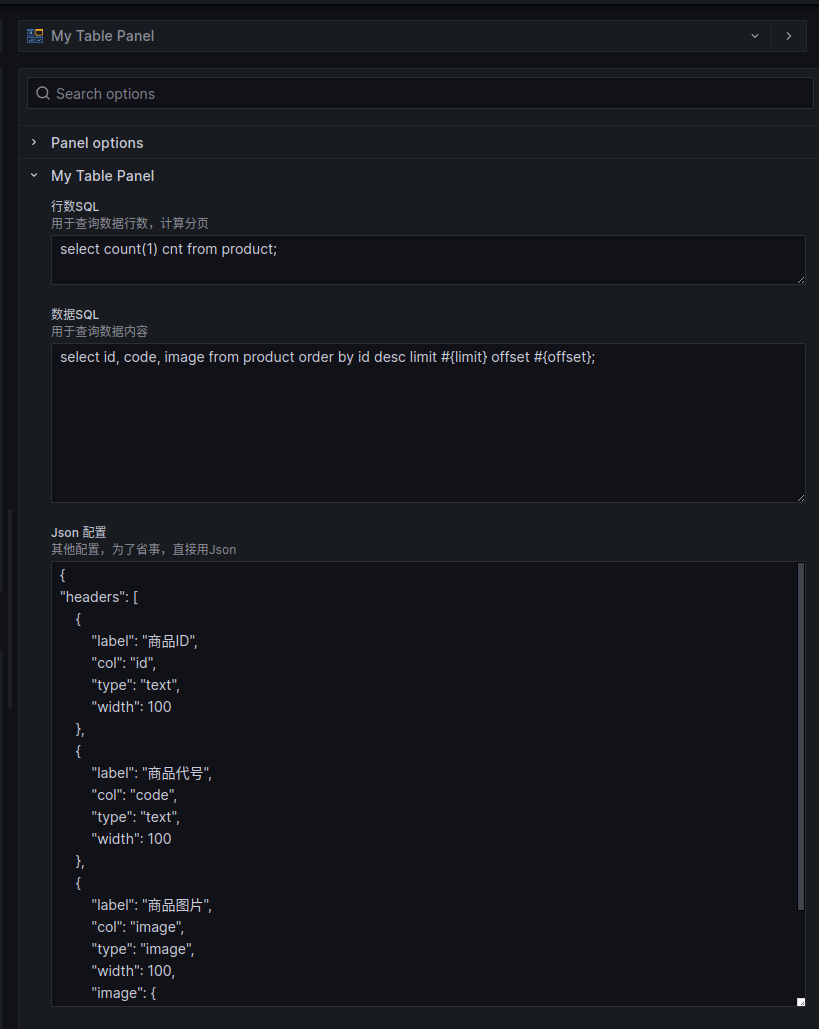
const { countSql, sql, jsonConfig } = options; // 读取配置项
const [pageNo, setPageNo] = React.useState(1); // 分页,当前页
const [pageSize, setPageSize] = React.useState(10); // 分页,每页行数
const [spinning, setSpinning] = React.useState(false); // 加载中
const [tdata, setTdata] = React.useState<any[]>([]); // 表格数据
const [total, setTotal] = React.useState(0); // 总行数
const sqls = { countSql: replaceVariables(countSql), sql: replaceVariables(sql) } // 配置的SQL,这里最好进行加密处理,防止前端sql注入
const jsonConfigObj: OptionsJsonConfig = JSON.parse(jsonConfig); // 配置的jsonConfig, 主要用于表头配置
const handleValueType = (text: string, valueType: string) => { // 处理数据类型, 1.0000 -> 1
if (valueType === 'number') {
return parseFloat(text).toString();
}
return text;
}
const columns: ColumnsType<any> = jsonConfigObj.headers.map((header) => { // 根据配置,生成表头
return {
title: header.label,
dataIndex: header.col,
key: header.col,
width: header.width,
render: (text) => <div>{header.type === 'image' ? <img src={text} style={{ width: header.image?.width ?? '40px' }} /> : <span>{handleValueType(text, header.valueType)}</span>}</div>,
}
})
useEffect(() => { // 加载数据
setSpinning(true);
axios.post(`load_data_url`, { // 服务端实现查询数据接口
pageNo,
pageSize,
sqls: sqls
}).then((res) => {
setSpinning(false);
console.log('res', res);
const d = res?.data?.Data ?? { columns: [], datas: [], total: 0 };
const { columns, datas, total } = d;
const tdata: any[] = (datas || []).map((row: string[]) => {
const obj: any = {};
(columns || []).forEach((col: string, index: number) => {
obj[col] = row[index];
})
return obj;
});
setTdata(tdata);
setTotal(total);
if (pageNo > 1 && (pageNo - 1) * pageSize >= total) {
setPageNo(1)
}
})
}, [pageNo, sqls, pageSize]) // hook监控, 当pageNo, sqls, pageSize变化时,重新加载数据
const downloadExcel = () => { // 下载excel
setSpinning(true);
axios.post(`gen_download_url`, { // 服务端实现查询数据并生成excel链接接口
headers: jsonConfigObj.headers,
sqls: sqls
}).then((res) => {
setSpinning(false);
console.log('res', res);
const d = res?.data?.data ?? { fileName: '' };
const { fileName } = d;
if (fileName) {
window.location.href = ('download_前缀' + fileName); // 服务端实现下载接口
}
})
}
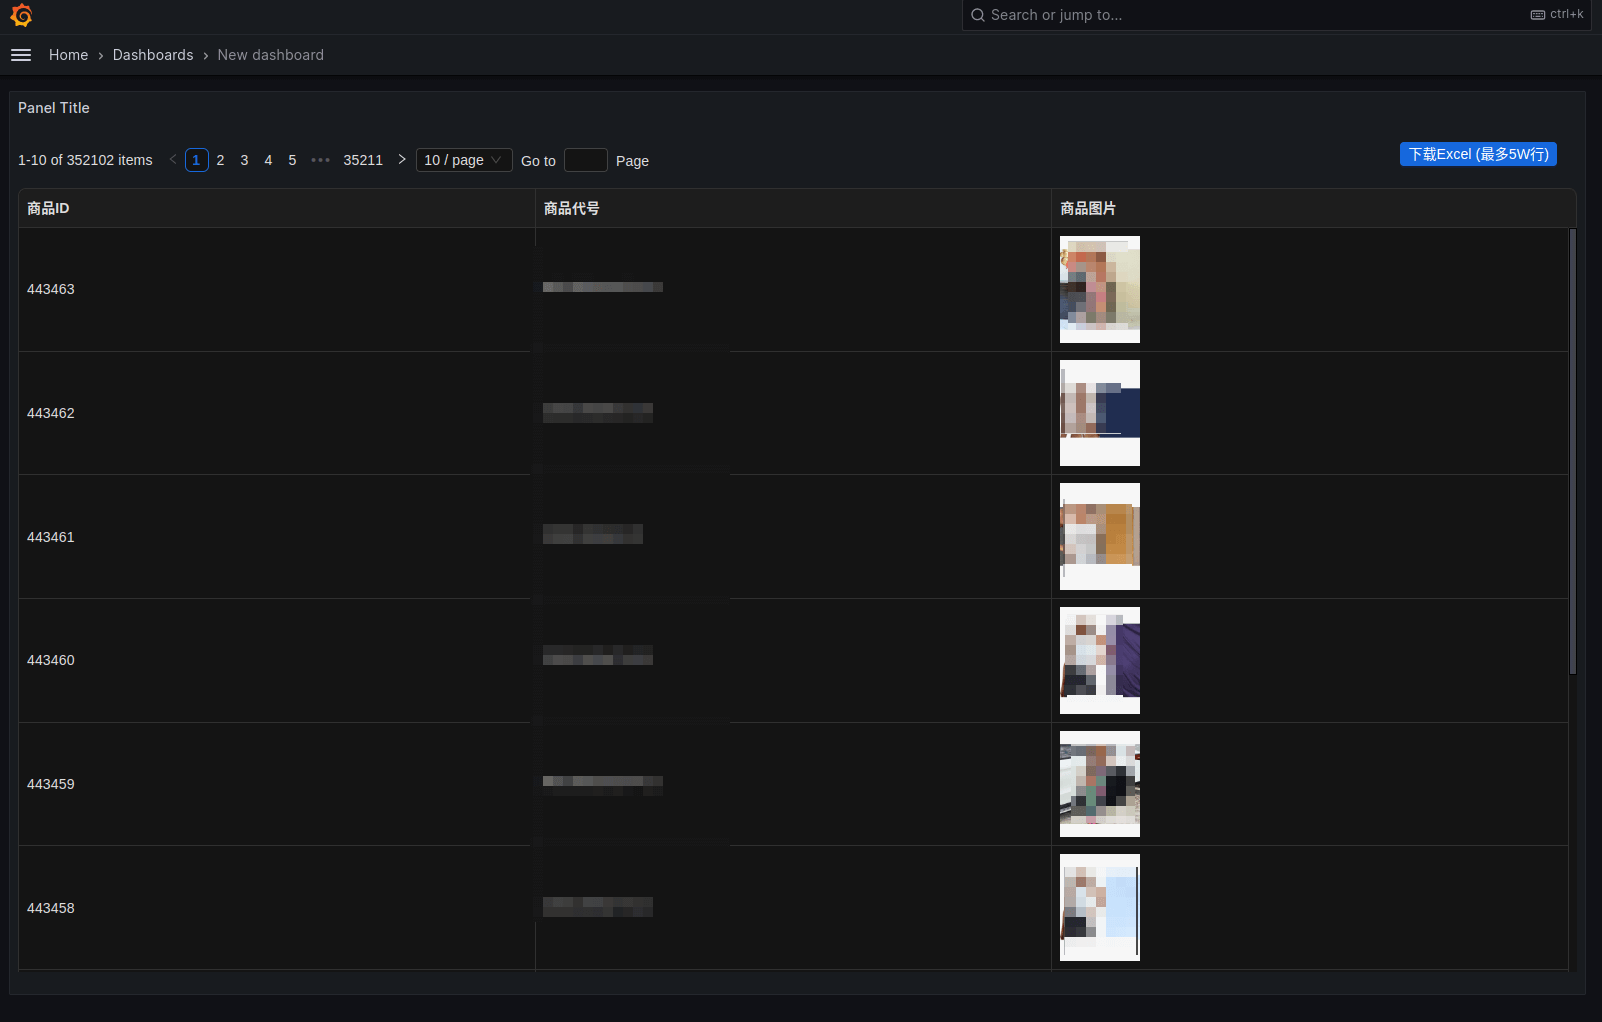
return ( // 渲染表格
<div className={cx(
styles.wrapper,
css`
width: ${width}px;
height: ${height}px;
`
)}>
<ConfigProvider theme={{ algorithm: darkAlgorithm }}> {/* antd主题 */}
<Spin tip="Loading..." spinning={spinning}> {/* 加载中 */}
<Table columns={columns} dataSource={tdata} scroll={{ y: height - 110 }} bordered={true} size='small'
pagination={{
position: ['topLeft'],
pageSizeOptions: [10, 20, 50, 100],
defaultPageSize: 10,
total: total,
showTotal: (total, range) => `${range[0]}-${range[1]} of ${total} items`,
onChange: (page, pageSize) => {
setPageNo(page);
setPageSize(pageSize ?? 10);
},
showSizeChanger: true,
size: 'small',
showQuickJumper: true,
}} /> {/* 表格 */}
</Spin>
<Button type="primary" onClick={downloadExcel} style={{ position: 'absolute', right: 20, top: 10 }} size='small'>下载Excel (最多5W行)</Button> {/* 下载excel按钮 */}
</ConfigProvider>
</div>
);
};
|